> ## Documentation Index
> Fetch the complete documentation index at: https://noradocs.solomontsao.com/llms.txt
> Use this file to discover all available pages before exploring further.
# Monitoring
# Monitor agent health and performance in Nora
> View platform metrics, agent-level CPU and memory stats, activity events, cost tracking, and historical performance data for your agents in Nora.
Nora collects runtime metrics, activity events, and cost data for every agent you deploy. You can view a live snapshot of an agent's resource usage, pull historical stats over configurable time windows, browse the activity event log, and check accumulated cost data — all from the dashboard or the monitoring API. This page explains what data is collected, how to read it, and the available time ranges for historical queries.
## Platform metrics overview
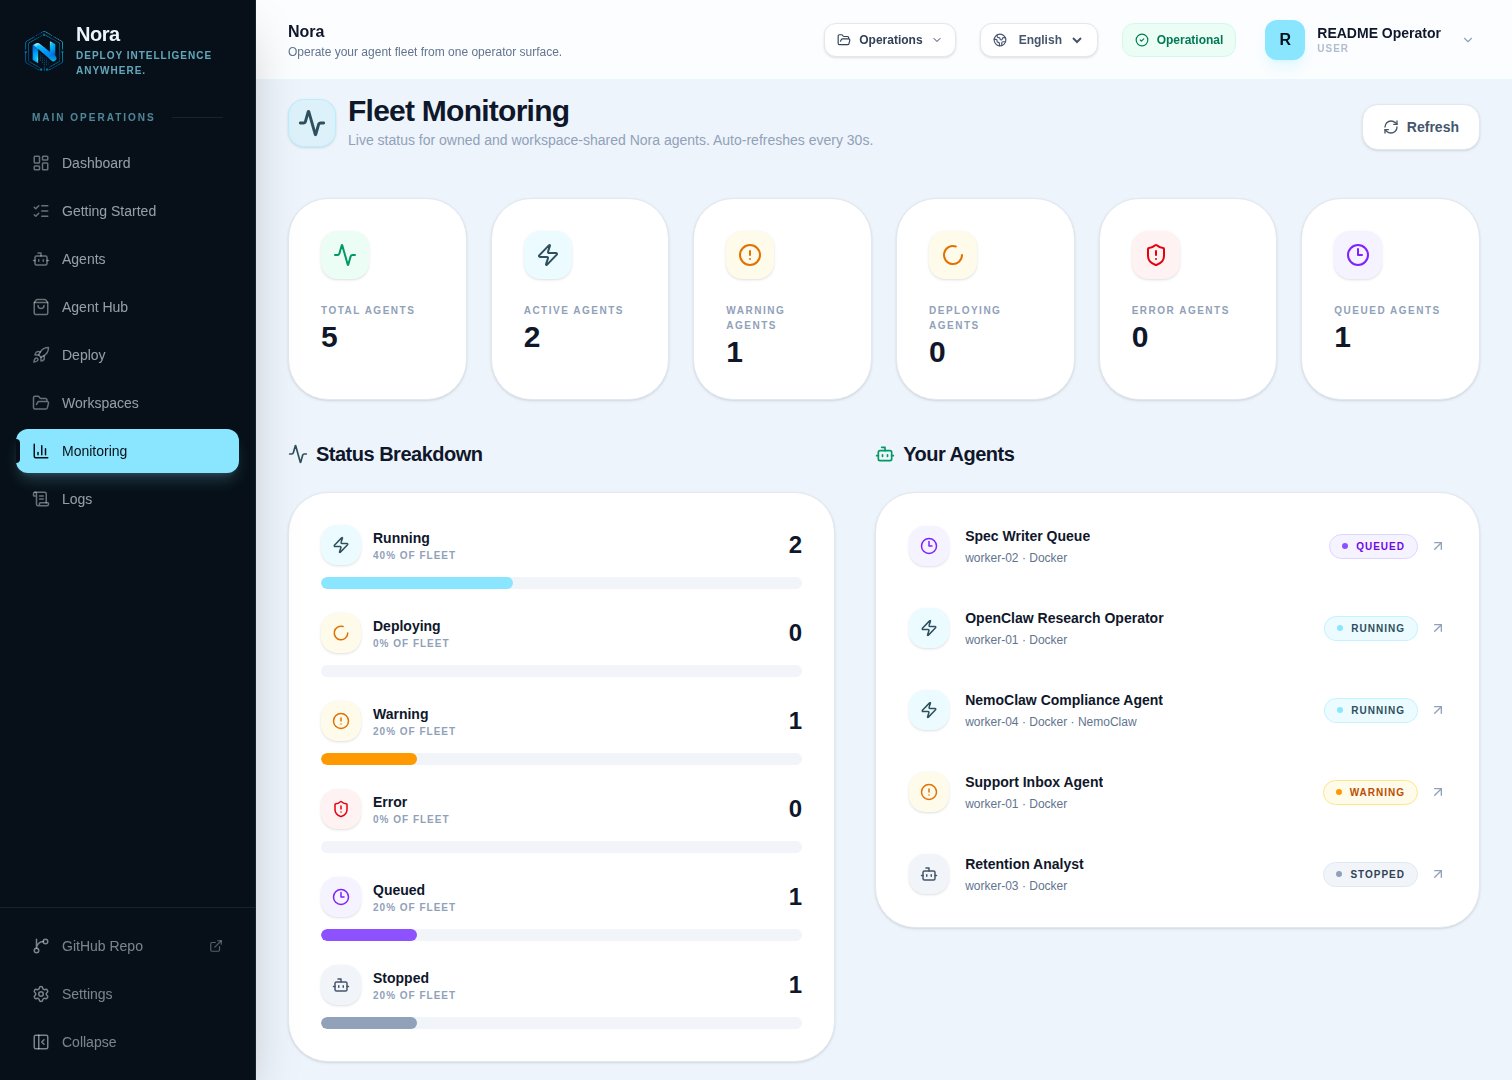 The platform-level monitoring endpoint returns aggregate statistics across all agents you can access, including directly owned agents and agents shared with you through workspaces. It includes totals for running agents, queued jobs, and recent activity.
```http theme={null} theme={null}
GET /api/monitoring/metrics
```
Use this endpoint to get a high-level picture of your deployment before drilling into individual agents.
## Fleet needs-attention
The operator dashboard (`/app`) shows a **Needs attention** strip at the top that lists the agents you should look at right now and why. It is derived server-side at read time from existing state — no extra configuration — and stays hidden when the fleet is healthy, so it never adds noise to an all-clear deployment.
It surfaces these reasons:
| Reason | Severity | Condition |
| ------------------ | -------- | ----------------------------------------------------------------------- |
| Errored | error | Agent status is `error` |
| Budget cap reached | error | Agent is paused at a budget cap (`paused_reason = budget_exceeded`) |
| Stuck deploying | warning | Agent has been queued or deploying for more than 10 minutes |
| Approaching budget | warning | A running agent has crossed a budget soft threshold |
| Stalled telemetry | warning | A running agent has reported no container stats for more than 5 minutes |
Errors sort before warnings. The strip covers the agents you can access — directly owned plus workspace-shared. It is backed by the [fleet needs-attention roll-up](/api/monitoring) API (`GET /monitoring/fleet-status`, requires the `monitoring:read` scope), and the `nora doctor` [Fleet-health check](/guides/doctor) is built on the same roll-up.
## Agent-level metrics
Each agent exposes a live stats snapshot and a historical stats series. Stats are collected every **5 seconds** and retained for **7 days**.
### Live stats
To fetch the current resource usage for a running agent:
```http theme={null} theme={null}
GET /api/agents/:id/stats
```
The response includes the following fields:
| Field | Type | Description |
| ----------------- | ------- | ------------------------------------------------------------------- |
| `cpu_percent` | number | Current CPU usage as a percentage across all cores |
| `memory_usage_mb` | number | Actual memory in use (excluding cache), in megabytes |
| `memory_limit_mb` | number | Container memory limit, in megabytes |
| `memory_percent` | number | Memory usage as a percentage of the limit |
| `network_rx_mb` | number | Total bytes received across all network interfaces, in megabytes |
| `network_tx_mb` | number | Total bytes transmitted across all network interfaces, in megabytes |
| `disk_read_mb` | number | Total block device read bytes, in megabytes |
| `disk_write_mb` | number | Total block device write bytes, in megabytes |
| `pids` | number | Current number of processes (PIDs) in the container |
| `uptime_seconds` | number | Seconds since the container last started |
| `running` | boolean | Whether the container is currently running |
If the agent is stopped or has no container, the endpoint still returns `200` with `current.running: false` and an `error` field (e.g. "No container assigned") rather than live metrics.
### Historical stats
To fetch a time series of stats for an agent, use the history endpoint with a time range:
```http theme={null} theme={null}
GET /api/agents/:id/stats/history?range=15m
```
**Supported time ranges:**
| Parameter | Window |
| --------- | ------------------------- |
| `5m` | Last 5 minutes |
| `15m` | Last 15 minutes (default) |
| `30m` | Last 30 minutes |
| `1h` | Last 1 hour |
| `6h` | Last 6 hours |
| `24h` | Last 24 hours |
| `3d` | Last 3 days |
| `7d` | Last 7 days |
You can also query a custom window using ISO timestamps:
```http theme={null} theme={null}
GET /api/agents/:id/stats/history?from=2026-04-10T08:00:00Z&to=2026-04-10T09:00:00Z
```
Each data point in the history response contains the same metric fields as the live stats endpoint, plus a `recorded_at` timestamp. Results are ordered by `recorded_at` ascending and capped at 5000 rows for short windows (≤ 1 hour, returned un-aggregated) and 4000 rows for larger windows, which are time-bucketed/aggregated server-side.
**Historical stat fields:**
| Field | Description |
| ----------------- | ----------------------------------------------- |
| `cpu_percent` | CPU usage at that sample point |
| `memory_usage_mb` | Memory in use at that sample point |
| `memory_limit_mb` | Memory limit at that sample point |
| `memory_percent` | Memory usage percentage at that sample point |
| `network_rx_mb` | Cumulative network receive bytes |
| `network_tx_mb` | Cumulative network transmit bytes |
| `disk_read_mb` | Cumulative disk read bytes |
| `disk_write_mb` | Cumulative disk write bytes |
| `pids` | Process count at that sample point |
| `recorded_at` | ISO 8601 timestamp of when the sample was taken |
## Activity events
The events log records actions taken on agents and by agents — deployments, redeployments, errors, and other lifecycle events.
```http theme={null} theme={null}
GET /api/monitoring/events
```
To filter events to a specific agent:
```http theme={null} theme={null}
GET /api/monitoring/events?agentId=
```
You can also control the number of results returned:
```http theme={null} theme={null}
GET /api/monitoring/events?limit=100
```
The default limit is 50 events, ordered by `created_at` descending (newest first).
## Agent metrics summary
For a summarized view of an agent's metrics over the default 24-hour window:
```http theme={null} theme={null}
GET /api/agents/:id/metrics/summary
```
This returns aggregated highs, lows, and averages rather than individual data points — useful for a quick health check.
For the full time-series data with optional type and date filters:
```http theme={null} theme={null}
GET /api/agents/:id/metrics?type=cpu&since=2026-04-09T00:00:00Z
```
## Agent cost tracking
The platform-level monitoring endpoint returns aggregate statistics across all agents you can access, including directly owned agents and agents shared with you through workspaces. It includes totals for running agents, queued jobs, and recent activity.
```http theme={null} theme={null}
GET /api/monitoring/metrics
```
Use this endpoint to get a high-level picture of your deployment before drilling into individual agents.
## Fleet needs-attention
The operator dashboard (`/app`) shows a **Needs attention** strip at the top that lists the agents you should look at right now and why. It is derived server-side at read time from existing state — no extra configuration — and stays hidden when the fleet is healthy, so it never adds noise to an all-clear deployment.
It surfaces these reasons:
| Reason | Severity | Condition |
| ------------------ | -------- | ----------------------------------------------------------------------- |
| Errored | error | Agent status is `error` |
| Budget cap reached | error | Agent is paused at a budget cap (`paused_reason = budget_exceeded`) |
| Stuck deploying | warning | Agent has been queued or deploying for more than 10 minutes |
| Approaching budget | warning | A running agent has crossed a budget soft threshold |
| Stalled telemetry | warning | A running agent has reported no container stats for more than 5 minutes |
Errors sort before warnings. The strip covers the agents you can access — directly owned plus workspace-shared. It is backed by the [fleet needs-attention roll-up](/api/monitoring) API (`GET /monitoring/fleet-status`, requires the `monitoring:read` scope), and the `nora doctor` [Fleet-health check](/guides/doctor) is built on the same roll-up.
## Agent-level metrics
Each agent exposes a live stats snapshot and a historical stats series. Stats are collected every **5 seconds** and retained for **7 days**.
### Live stats
To fetch the current resource usage for a running agent:
```http theme={null} theme={null}
GET /api/agents/:id/stats
```
The response includes the following fields:
| Field | Type | Description |
| ----------------- | ------- | ------------------------------------------------------------------- |
| `cpu_percent` | number | Current CPU usage as a percentage across all cores |
| `memory_usage_mb` | number | Actual memory in use (excluding cache), in megabytes |
| `memory_limit_mb` | number | Container memory limit, in megabytes |
| `memory_percent` | number | Memory usage as a percentage of the limit |
| `network_rx_mb` | number | Total bytes received across all network interfaces, in megabytes |
| `network_tx_mb` | number | Total bytes transmitted across all network interfaces, in megabytes |
| `disk_read_mb` | number | Total block device read bytes, in megabytes |
| `disk_write_mb` | number | Total block device write bytes, in megabytes |
| `pids` | number | Current number of processes (PIDs) in the container |
| `uptime_seconds` | number | Seconds since the container last started |
| `running` | boolean | Whether the container is currently running |
If the agent is stopped or has no container, the endpoint still returns `200` with `current.running: false` and an `error` field (e.g. "No container assigned") rather than live metrics.
### Historical stats
To fetch a time series of stats for an agent, use the history endpoint with a time range:
```http theme={null} theme={null}
GET /api/agents/:id/stats/history?range=15m
```
**Supported time ranges:**
| Parameter | Window |
| --------- | ------------------------- |
| `5m` | Last 5 minutes |
| `15m` | Last 15 minutes (default) |
| `30m` | Last 30 minutes |
| `1h` | Last 1 hour |
| `6h` | Last 6 hours |
| `24h` | Last 24 hours |
| `3d` | Last 3 days |
| `7d` | Last 7 days |
You can also query a custom window using ISO timestamps:
```http theme={null} theme={null}
GET /api/agents/:id/stats/history?from=2026-04-10T08:00:00Z&to=2026-04-10T09:00:00Z
```
Each data point in the history response contains the same metric fields as the live stats endpoint, plus a `recorded_at` timestamp. Results are ordered by `recorded_at` ascending and capped at 5000 rows for short windows (≤ 1 hour, returned un-aggregated) and 4000 rows for larger windows, which are time-bucketed/aggregated server-side.
**Historical stat fields:**
| Field | Description |
| ----------------- | ----------------------------------------------- |
| `cpu_percent` | CPU usage at that sample point |
| `memory_usage_mb` | Memory in use at that sample point |
| `memory_limit_mb` | Memory limit at that sample point |
| `memory_percent` | Memory usage percentage at that sample point |
| `network_rx_mb` | Cumulative network receive bytes |
| `network_tx_mb` | Cumulative network transmit bytes |
| `disk_read_mb` | Cumulative disk read bytes |
| `disk_write_mb` | Cumulative disk write bytes |
| `pids` | Process count at that sample point |
| `recorded_at` | ISO 8601 timestamp of when the sample was taken |
## Activity events
The events log records actions taken on agents and by agents — deployments, redeployments, errors, and other lifecycle events.
```http theme={null} theme={null}
GET /api/monitoring/events
```
To filter events to a specific agent:
```http theme={null} theme={null}
GET /api/monitoring/events?agentId=
```
You can also control the number of results returned:
```http theme={null} theme={null}
GET /api/monitoring/events?limit=100
```
The default limit is 50 events, ordered by `created_at` descending (newest first).
## Agent metrics summary
For a summarized view of an agent's metrics over the default 24-hour window:
```http theme={null} theme={null}
GET /api/agents/:id/metrics/summary
```
This returns aggregated highs, lows, and averages rather than individual data points — useful for a quick health check.
For the full time-series data with optional type and date filters:
```http theme={null} theme={null}
GET /api/agents/:id/metrics?type=cpu&since=2026-04-09T00:00:00Z
```
## Agent cost tracking
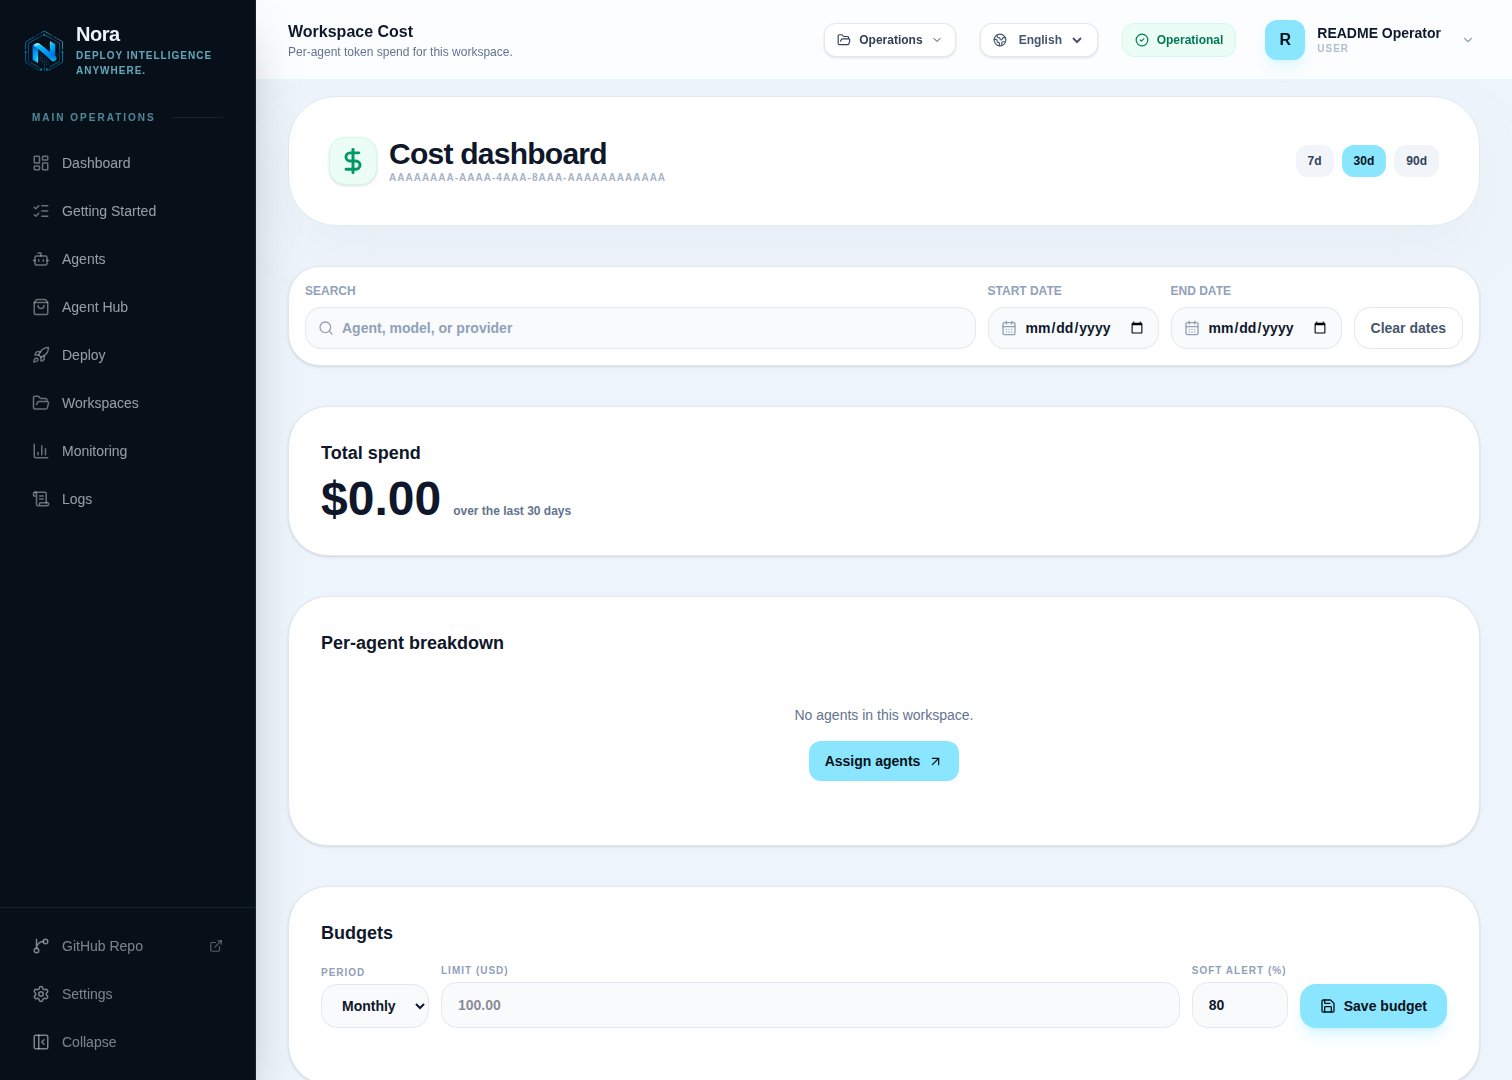 Nora tracks token usage for each agent and estimates spend from model rates. The operator cost dashboard groups token spend by workspace, links each row back to the related agent, and reports a unique fleet total so an agent assigned to multiple workspaces is not double-counted. Each agent row can show token usage grouped by model.
To view the all-workspaces cost dashboard through the API:
```http theme={null} theme={null}
GET /api/workspaces/cost?period_days=30
```
Use `period_start=YYYY-MM-DD&period_end=YYYY-MM-DD` for a custom UTC date range. The dashboard also supports searching by workspace, agent, model, or provider.
The response includes `workspaces[]`, `unassigned.perAgent[]`, `workspaceTotalUsd`, `uniqueFleetTotalUsd`, and each agent's `cost_details.tokens`. Use `uniqueFleetTotalUsd` for fleet-wide totals and workspace totals for team-level budgeting.
Token cost uses `COST_MODEL_RATES_JSON` when the metric row includes model metadata. Rows without model metadata are grouped as `Unknown model` and priced with `COST_PER_1K_TOKENS`.
To view the accumulated cost data for one agent:
```http theme={null} theme={null}
GET /api/agents/:id/cost
```
The response includes token totals and usage breakdowns. If the agent exists but has no recorded token usage in the selected window, totals are zero.
To view one workspace's cost breakdown:
```http theme={null} theme={null}
GET /api/workspaces/:id/cost?period_days=30
```
## Per-agent budget caps
You can cap an agent's LLM spend so it pauses itself before it runs away. Open an agent's **Settings** tab and set one budget per period — `daily`, `weekly`, or `monthly` — each with a USD hard limit and a soft-threshold percent (default `80`).
Nora enforces budgets automatically:
* When spend crosses the soft threshold, Nora emits an `agent.budget_soft_exceeded` event as an early warning.
* When spend reaches 100% of a period's limit, Nora pauses the runtime automatically, emits `agent.budget_exceeded`, and sets `paused_reason = budget_exceeded`.
* Manually starting a still-over-cap agent clears `paused_reason`, but the budget sweep re-pauses it on its next cycle (within roughly a minute) while it remains over cap.
Manage budgets through the API with `GET /api/agents/:id/budget`, `PUT /api/agents/:id/budget`, and `DELETE /api/agents/:id/budget/:budgetId` (see the [agents API reference](/api/agents)).
## Performance data
Platform-level API performance metrics are available for the last 24 hours by default:
```http theme={null} theme={null}
GET /api/monitoring/performance
```
You can narrow the window with a `since` parameter:
```http theme={null} theme={null}
GET /api/monitoring/performance?since=2026-04-10T06:00:00Z
```
Use the 24-hour historical stats window combined with the activity events log to correlate performance dips with specific deployment or lifecycle events.
Nora tracks token usage for each agent and estimates spend from model rates. The operator cost dashboard groups token spend by workspace, links each row back to the related agent, and reports a unique fleet total so an agent assigned to multiple workspaces is not double-counted. Each agent row can show token usage grouped by model.
To view the all-workspaces cost dashboard through the API:
```http theme={null} theme={null}
GET /api/workspaces/cost?period_days=30
```
Use `period_start=YYYY-MM-DD&period_end=YYYY-MM-DD` for a custom UTC date range. The dashboard also supports searching by workspace, agent, model, or provider.
The response includes `workspaces[]`, `unassigned.perAgent[]`, `workspaceTotalUsd`, `uniqueFleetTotalUsd`, and each agent's `cost_details.tokens`. Use `uniqueFleetTotalUsd` for fleet-wide totals and workspace totals for team-level budgeting.
Token cost uses `COST_MODEL_RATES_JSON` when the metric row includes model metadata. Rows without model metadata are grouped as `Unknown model` and priced with `COST_PER_1K_TOKENS`.
To view the accumulated cost data for one agent:
```http theme={null} theme={null}
GET /api/agents/:id/cost
```
The response includes token totals and usage breakdowns. If the agent exists but has no recorded token usage in the selected window, totals are zero.
To view one workspace's cost breakdown:
```http theme={null} theme={null}
GET /api/workspaces/:id/cost?period_days=30
```
## Per-agent budget caps
You can cap an agent's LLM spend so it pauses itself before it runs away. Open an agent's **Settings** tab and set one budget per period — `daily`, `weekly`, or `monthly` — each with a USD hard limit and a soft-threshold percent (default `80`).
Nora enforces budgets automatically:
* When spend crosses the soft threshold, Nora emits an `agent.budget_soft_exceeded` event as an early warning.
* When spend reaches 100% of a period's limit, Nora pauses the runtime automatically, emits `agent.budget_exceeded`, and sets `paused_reason = budget_exceeded`.
* Manually starting a still-over-cap agent clears `paused_reason`, but the budget sweep re-pauses it on its next cycle (within roughly a minute) while it remains over cap.
Manage budgets through the API with `GET /api/agents/:id/budget`, `PUT /api/agents/:id/budget`, and `DELETE /api/agents/:id/budget/:budgetId` (see the [agents API reference](/api/agents)).
## Performance data
Platform-level API performance metrics are available for the last 24 hours by default:
```http theme={null} theme={null}
GET /api/monitoring/performance
```
You can narrow the window with a `since` parameter:
```http theme={null} theme={null}
GET /api/monitoring/performance?since=2026-04-10T06:00:00Z
```
Use the 24-hour historical stats window combined with the activity events log to correlate performance dips with specific deployment or lifecycle events.